Guide Strategy and Improvement with Your Custom Benchmarking Report
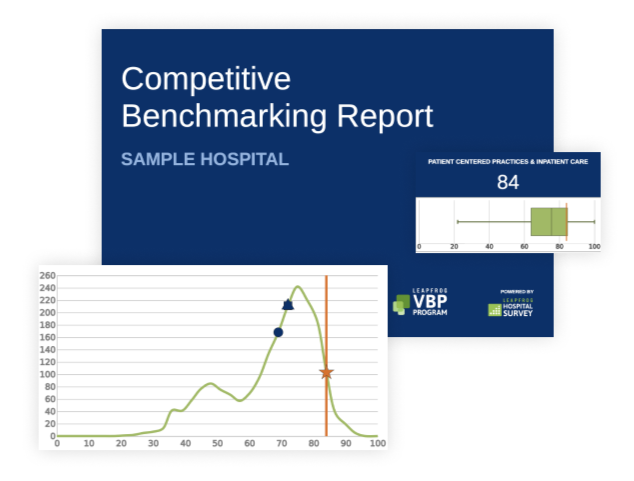
Using data submitted by more than 2,400 hospitals to the annual Leapfrog Hospital Survey, your Competitive Benchmarking Report provides detailed and actionable insight into how your hospital is performing in your market and nationwide.
See How Your Hospital Compares
Your Competitive Benchmarking Report includes your latest scores on up to 44 national measures of safety, quality, and efficiency across seven domains:
|
|
Medication safety |
|
Maternity care |
 |
Patient centered practices and inpatient care |  |
Pediatric care |
|
|
Infections |
 |
Adult complex surgical procedures |
 |
Outpatient procedures |


What your Competitive Benchmarking Report Can Do for Your Hospital
Internal Benchmarking
Benchmark by measure performance, in each of the seven domains, and by overall Value Score. These benchmarks help track trends, recognize areas of excellence, and identify areas for improvement.
Stakeholder Engagement
Easy-to-interpret data scores can be used to inform and engage board members and staff on current performance compare to national, state, and demographically similar hospitals. The report's clear and concise format makes it easy to present your Survey Results to engage multiple stakeholder groups, including medical staff, administrators, front-line caregivers, and boards of directors.
Quality Improvement
Report data can directly identify relevant process or outcome-based measures that need quality improvement to meet a higher standard of care.
Key Features of Your Competitive Benchmarking Report
 |
Individual Measure Scores Includes individual Measure Scores that range from 0 (worst performance) to 100 (best performance) |
|
Domain and Value Scores Assigns measure scores to one of seven domains, weights them, and uses them to calculate Domain Scores and an overall Value Score |
|
Benchmark Results & Analysis Summarize and benchmarks your Survey Results to provide a detailed, comparative performance analysis |
|
Trusted Leapfrog Data Utilizes data from Leapfrog participating hospitals across the country that are calculated based on the Leapfrog Value-Based Purchasing Program (VBP) methodologyTM . Reports ordered between September and January use Leapfrog Hospital Survey data as of August 31. Reports ordered between February and August use Leapfrog Hospital Survey data as of January 31. |
Competitive Benchmarking Report Pricing
| Basic | Premium (Best Value!) | Premium Plus (New!) |
|---|---|---|
| Every hospital that completes the Leapfrog Hospital Survey receives a free Basic summary report with your hospital's scores by domain. | For more detailed, comparative performance information, the Premium report digs deeper into each of the measures and compares critical aspects of your care to the care at other participating hospitals. | Get valuable insight from a Leapfrog expert who will contextualize your data, identifying problem spots and opportunities for strategic improvement. This tailored analysis is delivered in an executive report and delivered during a one-hour live review session, followed by a Q&A. |
|
Free When survey is completed by 6/30/25 |
$745 |
$4,900 |
| Your Basic report is automatically emailed to your hospital CEO and Survey Contact in September. | Order Your Report | Order Your Report |
See Everything IncludedIncludes:
|
See Everything IncludedIncludes everything in the Basic report, plus:
|
See Everything IncludedIncludes everything in the Premium report, plus:
|
Specialized Reports for Health Systems

For health systems, a custom cohort of your network facilities is available, allowing you to compare hospitals and identify the strong facilities in your system as well as those in need of improvement.
Contact our Help Desk for more information on pricing and how to order. We also offer a bulk discount of 20% off of two or more reports using code: LFCBR20.
Make the Most of Your Competitive Benchmarking Report
Recognize Excellence & Areas for Improvement
Use the color-coded individual Measure Scores to recognize areas of excellence and identify/prioritize opportunities for improvement.
Engage Hospital Leadership
Use the individual Measure Scores and Domain Scores to engage hospital leadership in a dialogue around performance on quality and safety.
Set Goals
Use the cohort, state, and national averages and overall Value Score and decile rankings to set goals for improvement.